
Scout
Monitor locations with the power of the Hivemapper Network
Introduction
Scout is perfect for anyone who wants to instantly begin accessing the Hivemapper Network’s fresh, high-quality imagery without directly working with the Map Image API.

Get Started
Login
Visit Scout and login using the preferred method: Continue with Google. Alternatively, you can link a Phantom account or use an email address with Breeze.
Buy Credits
Credits are needed to view imagery with Scout. Once logged in, navigate to Console > Developers and click Purchase Map Credits to load Map Credits into your account.

Add Locations
There are three ways to add locations to the map and view street level imagery.
1. Add Locations via Map
Click on a Road Segment

Then click on View Location

2. Add Locations file CSV File
Download example CSV file
The following types of locations are supported:
AddressPoint(Coordinate pair)PolygonMultiPolygon
The following attributes/properties are supported:
location: the location you want to Scout formatted as an Address, Point, Polygon or MultiPolygontype: differentiates between the types of locations (Address, Point, Polygon or MultiPolygon), especially when multiple types are included in the same uploadname: preferred identifier for this locationdescription: additional details about this locationtags: labels for grouping and filtering locations
3. Add Locations via GeoJSON
The minimum requirements for a GeoJSON upload include the location geometry and type as well as the name property. The description and tags are optional.
Example Polygon
{
    "type": "FeatureCollection",
    "features": [
        {
            "type": "Feature",
            "properties": {
              "name": "Central Ave",
              "description": "Monitoring this location for project 1",
              "tags": ["project1", "Phoenix"]
            },
            "geometry": {
              "type": "Polygon",
              "coordinates": [
                [
                  [
                    -112.0741711,
                    33.4728381
                  ],
                  [
                    -112.0734685,
                    33.4728319
                  ],
                  [
                    -112.0735055,
                    33.4712155
                  ],
                  [
                    -112.0741859,
                    33.4712155
                  ],
                  [
                    -112.0741711,
                    33.4728381
                  ]
                ]
              ]
            }
          }
    ]
}
Example MultiPolygon
{
  "type": "FeatureCollection",
  "features": [
    {
      "type": "Feature",
      "properties": {
        "name": "Central Ave",
        "description": "Monitoring this location for project 1",
        "tags": ["project1", "Phoenix"]
      },
      "geometry": {
        "type": "MultiPolygon",
        "coordinates": [
          [
            [
              [
                -112.0741711,
                33.4728381
              ],
              [
                -112.0734685,
                33.4728319
              ],
              [
                -112.0735055,
                33.4712155
              ],
              [
                -112.0741859,
                33.4712155
              ],
              [
                -112.0741711,
                33.4728381
              ]
            ]
          ],
          [
            [
              [
                -112.07418103422795,
                33.46749014499196
              ],
              [
                -112.07347843422795,
                33.46748394499197
              ],
              [
                -112.07351543422794,
                33.465867544991966
              ],
              [
                -112.07419583422795,
                33.465867544991966
              ],
              [
                -112.07418103422795,
                33.46749014499196
              ]
            ]
          ]
        ]
      }
    }
  ]
}
Product Capabilities
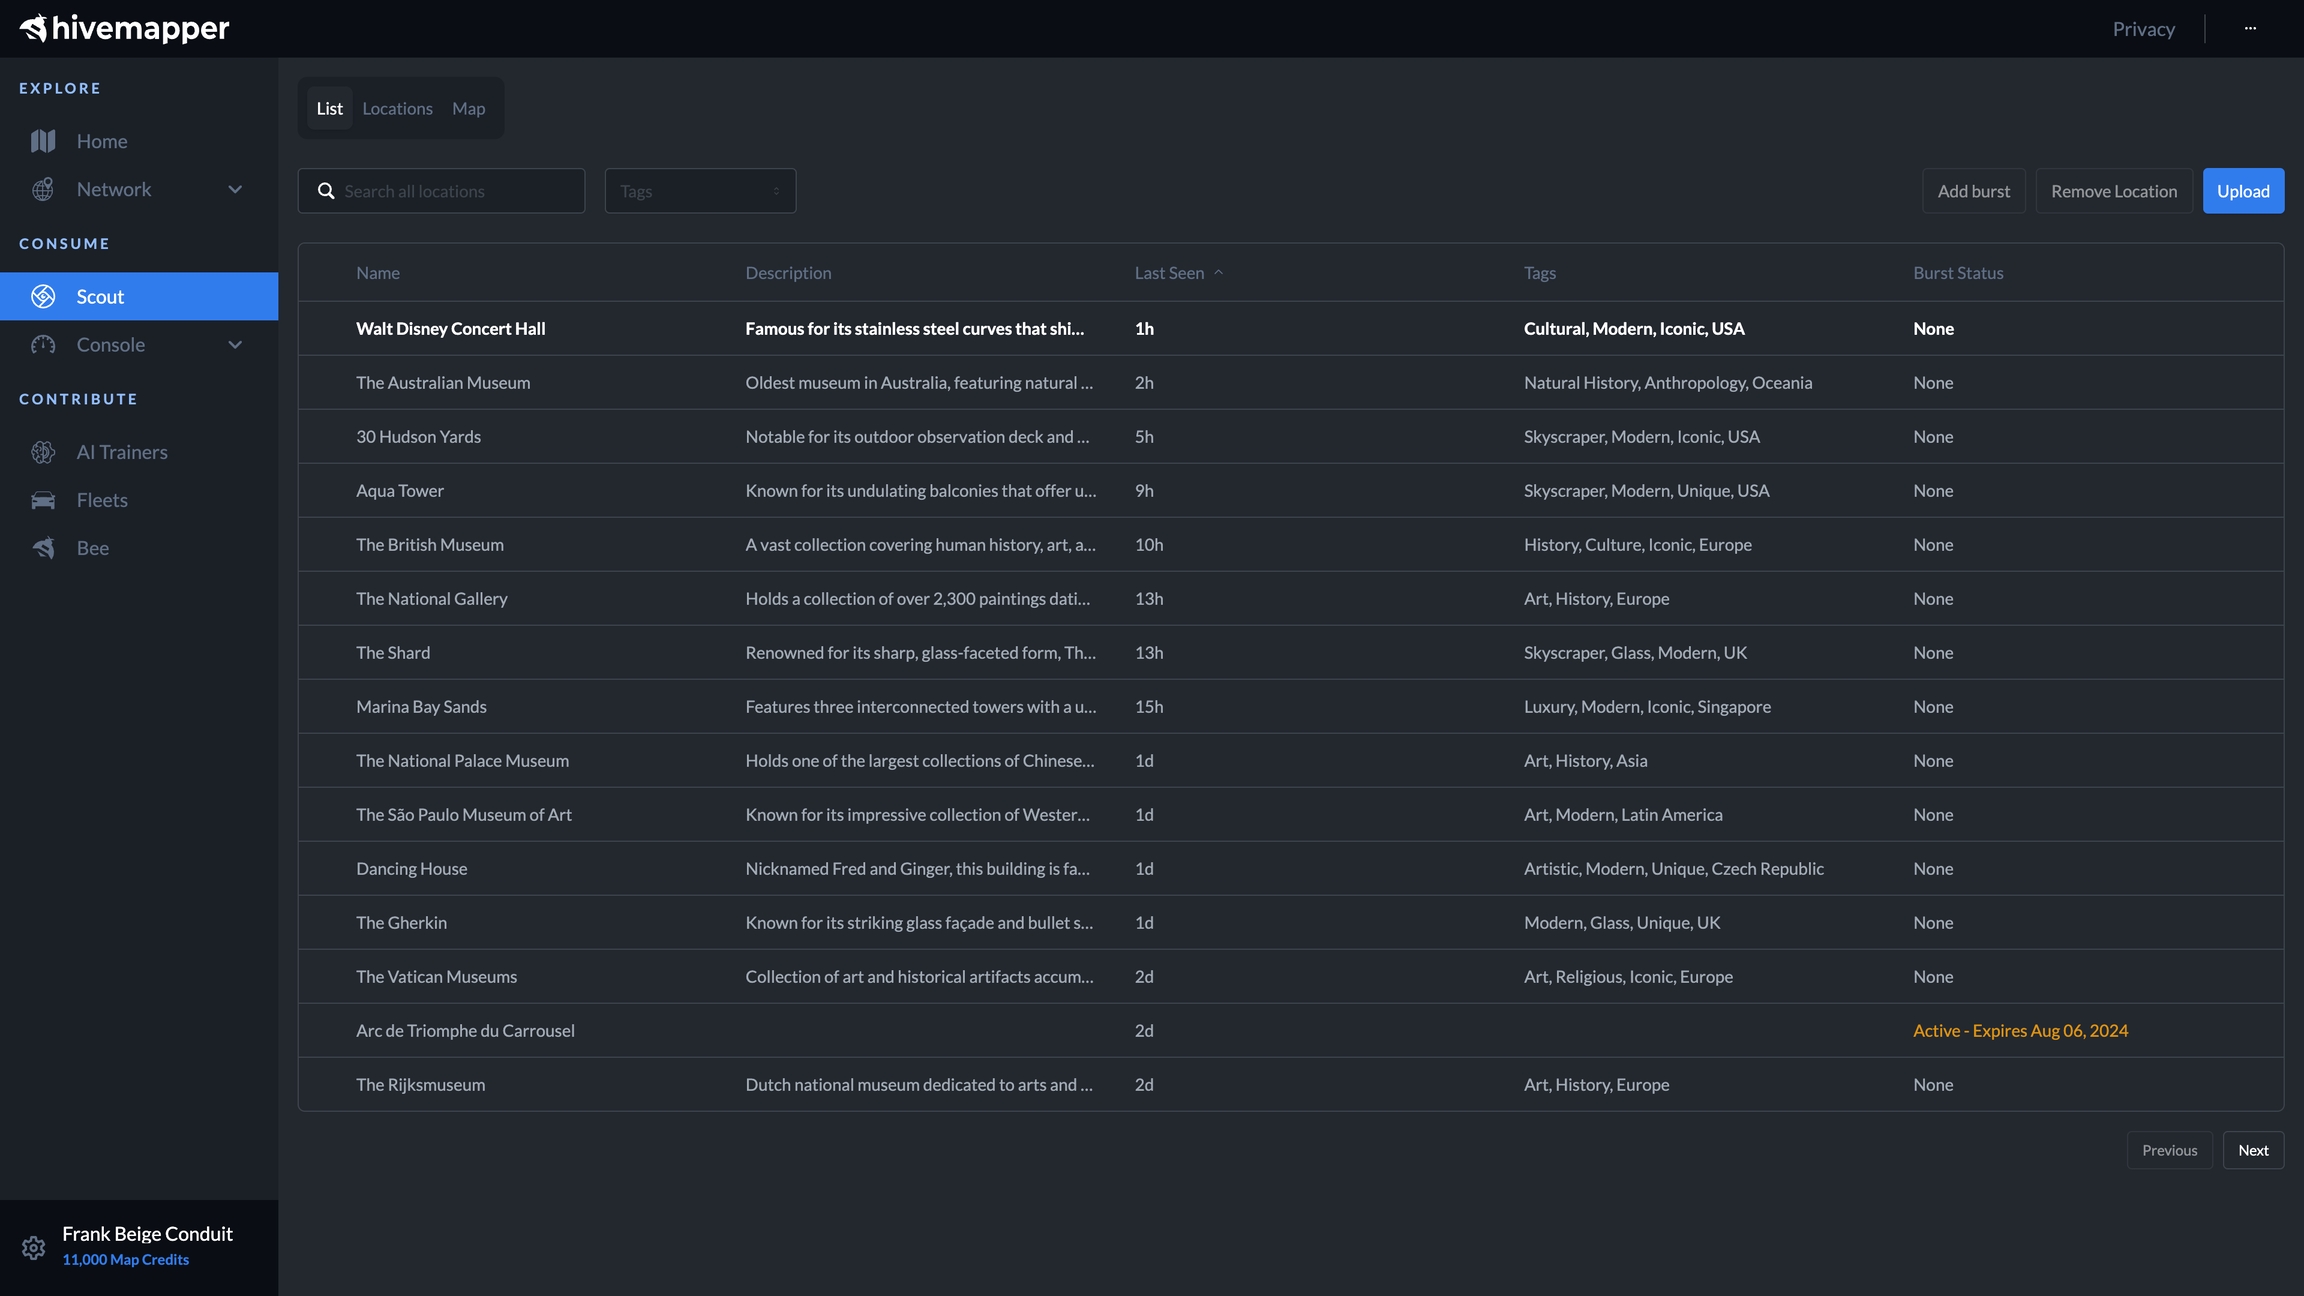
List
View monitored locations in a paginated, sortable, and multi-select list.
Rows are highlighted in bold if they contain fresh imagery that has not yet been seen by users or any members of their organization. Multi-select rows to Add Bursts or Remove Locations in bulk. The Search and Tag filter allows enables users to filter through their list. Additionally, users can upload GeoJSON or CSV files using the Upload button. The Burst Status column provides insight into whether locations have an Active Burst, Expired Burst, or None.
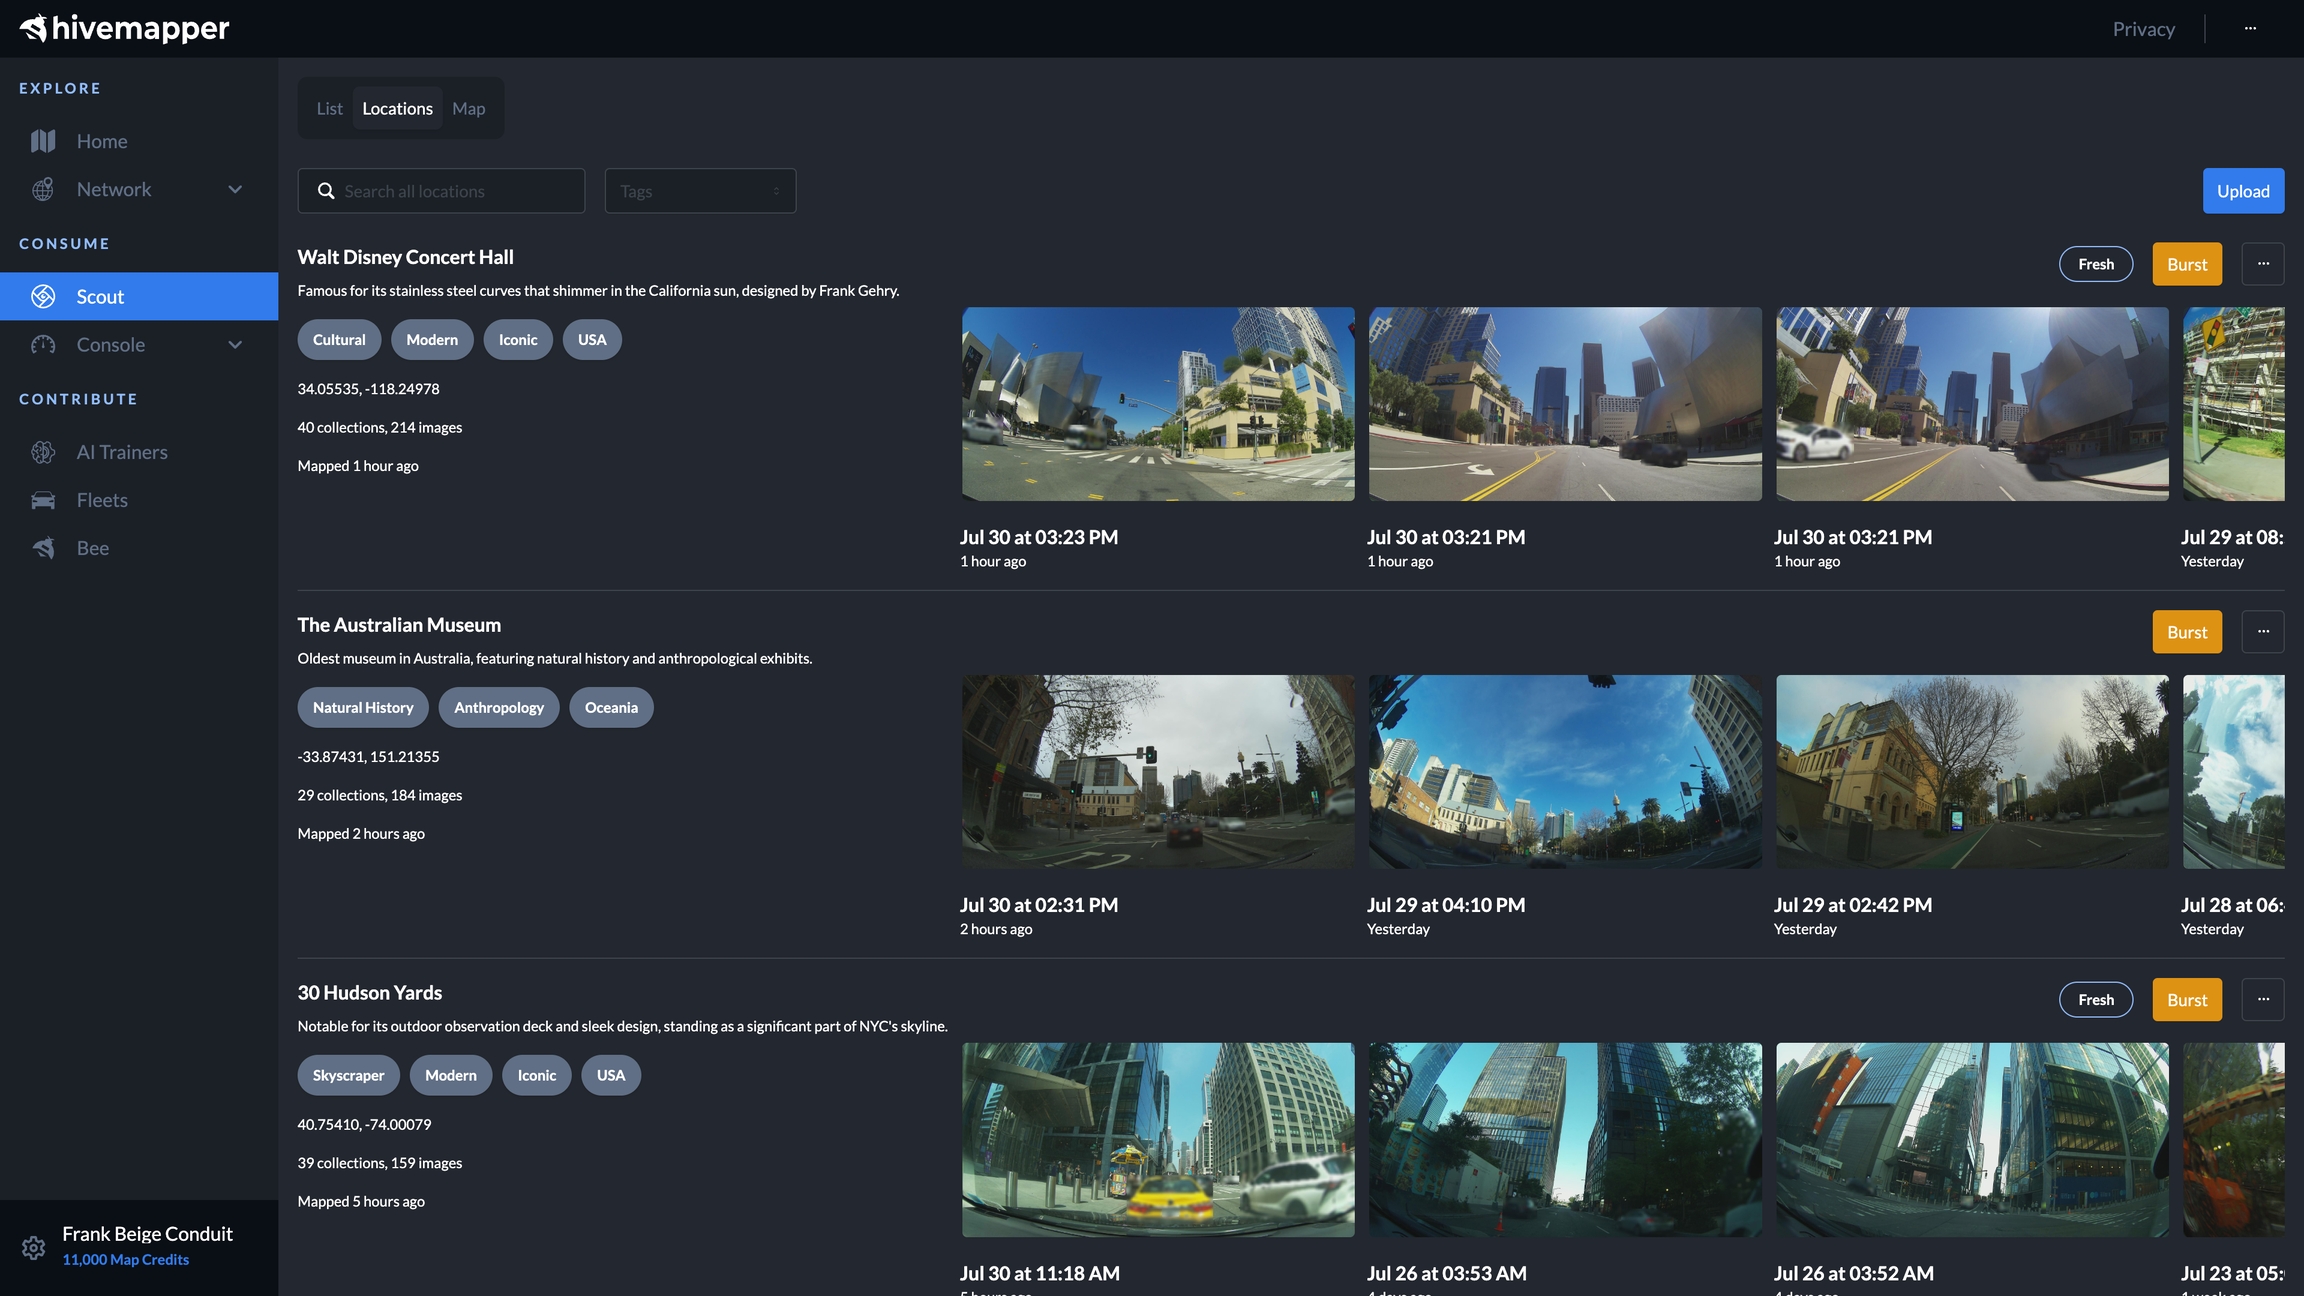
Locations
View monitored locations in a paginated list. Scroll left and right to view available image sequences from different times and/or dates. Clicking an image sequence will expand the location with all accessible imagery. Fresh indicators advise of locations with fresh imagery with nearby Burst buttons that enable users to Burst individual locations.
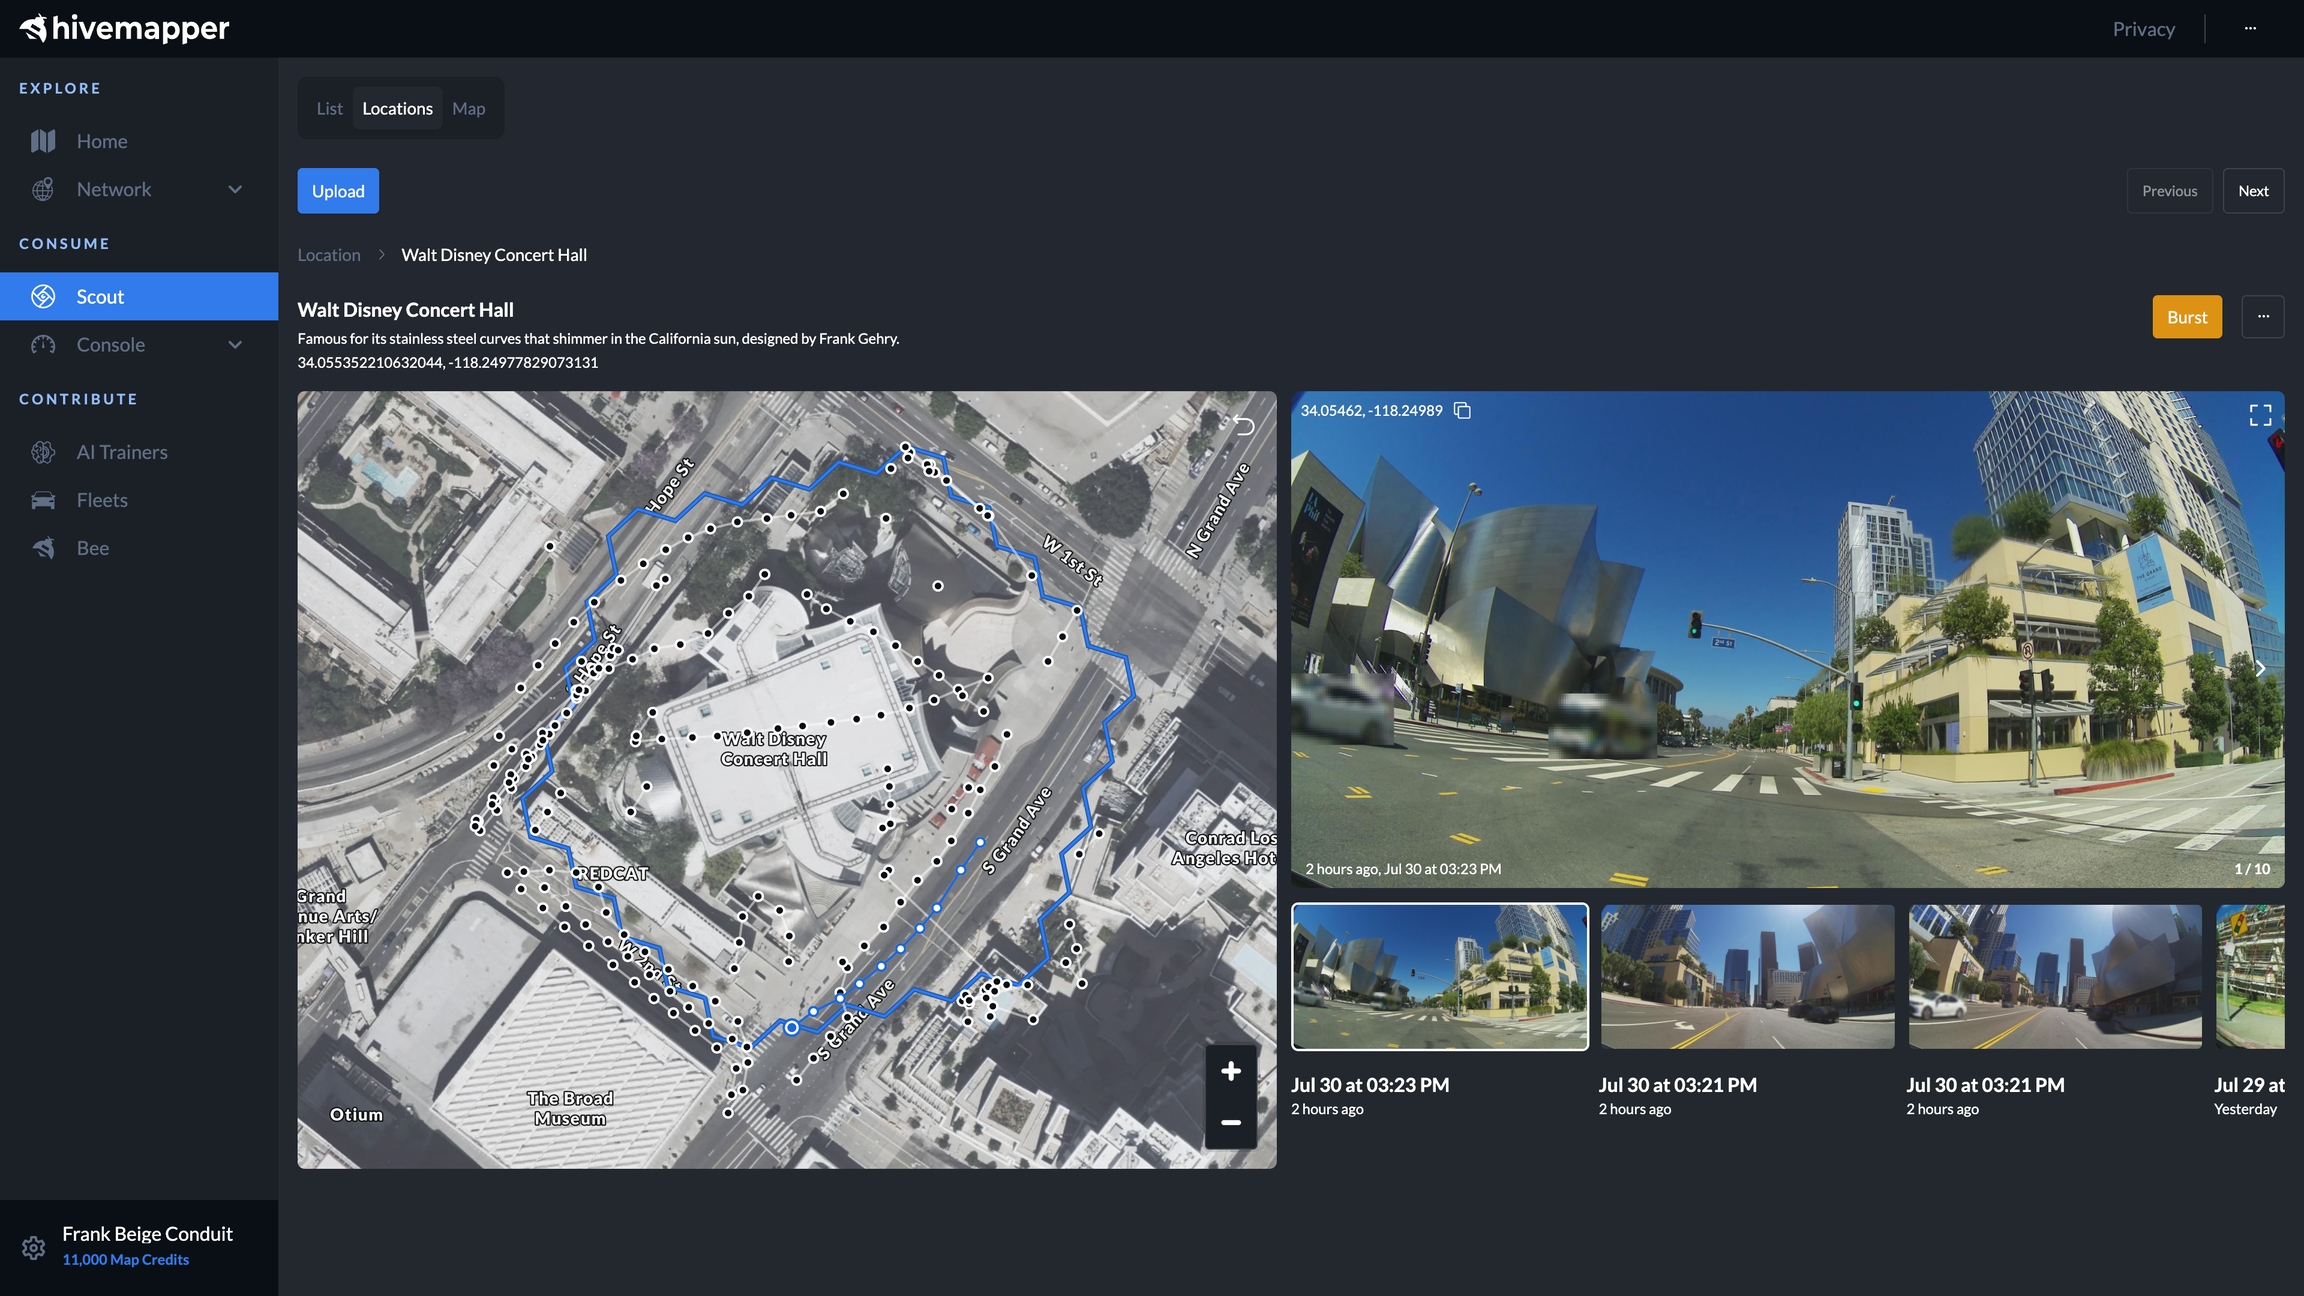
Location Details
Displays a single monitored location in a focused view. The map on the left displays the location of where images were taken. Click the dots on the map to view location specific imagery. Scroll through photos by clicking the left and right arrows on the imagery or by using the left and right arrows on your keyboard. The date and time images were taken are displayed along with the coordinates of where the image was taken can be viewed and copied from the top left corner of the image. Expand the image full screen by clicking the icon on the top right corner of the image.
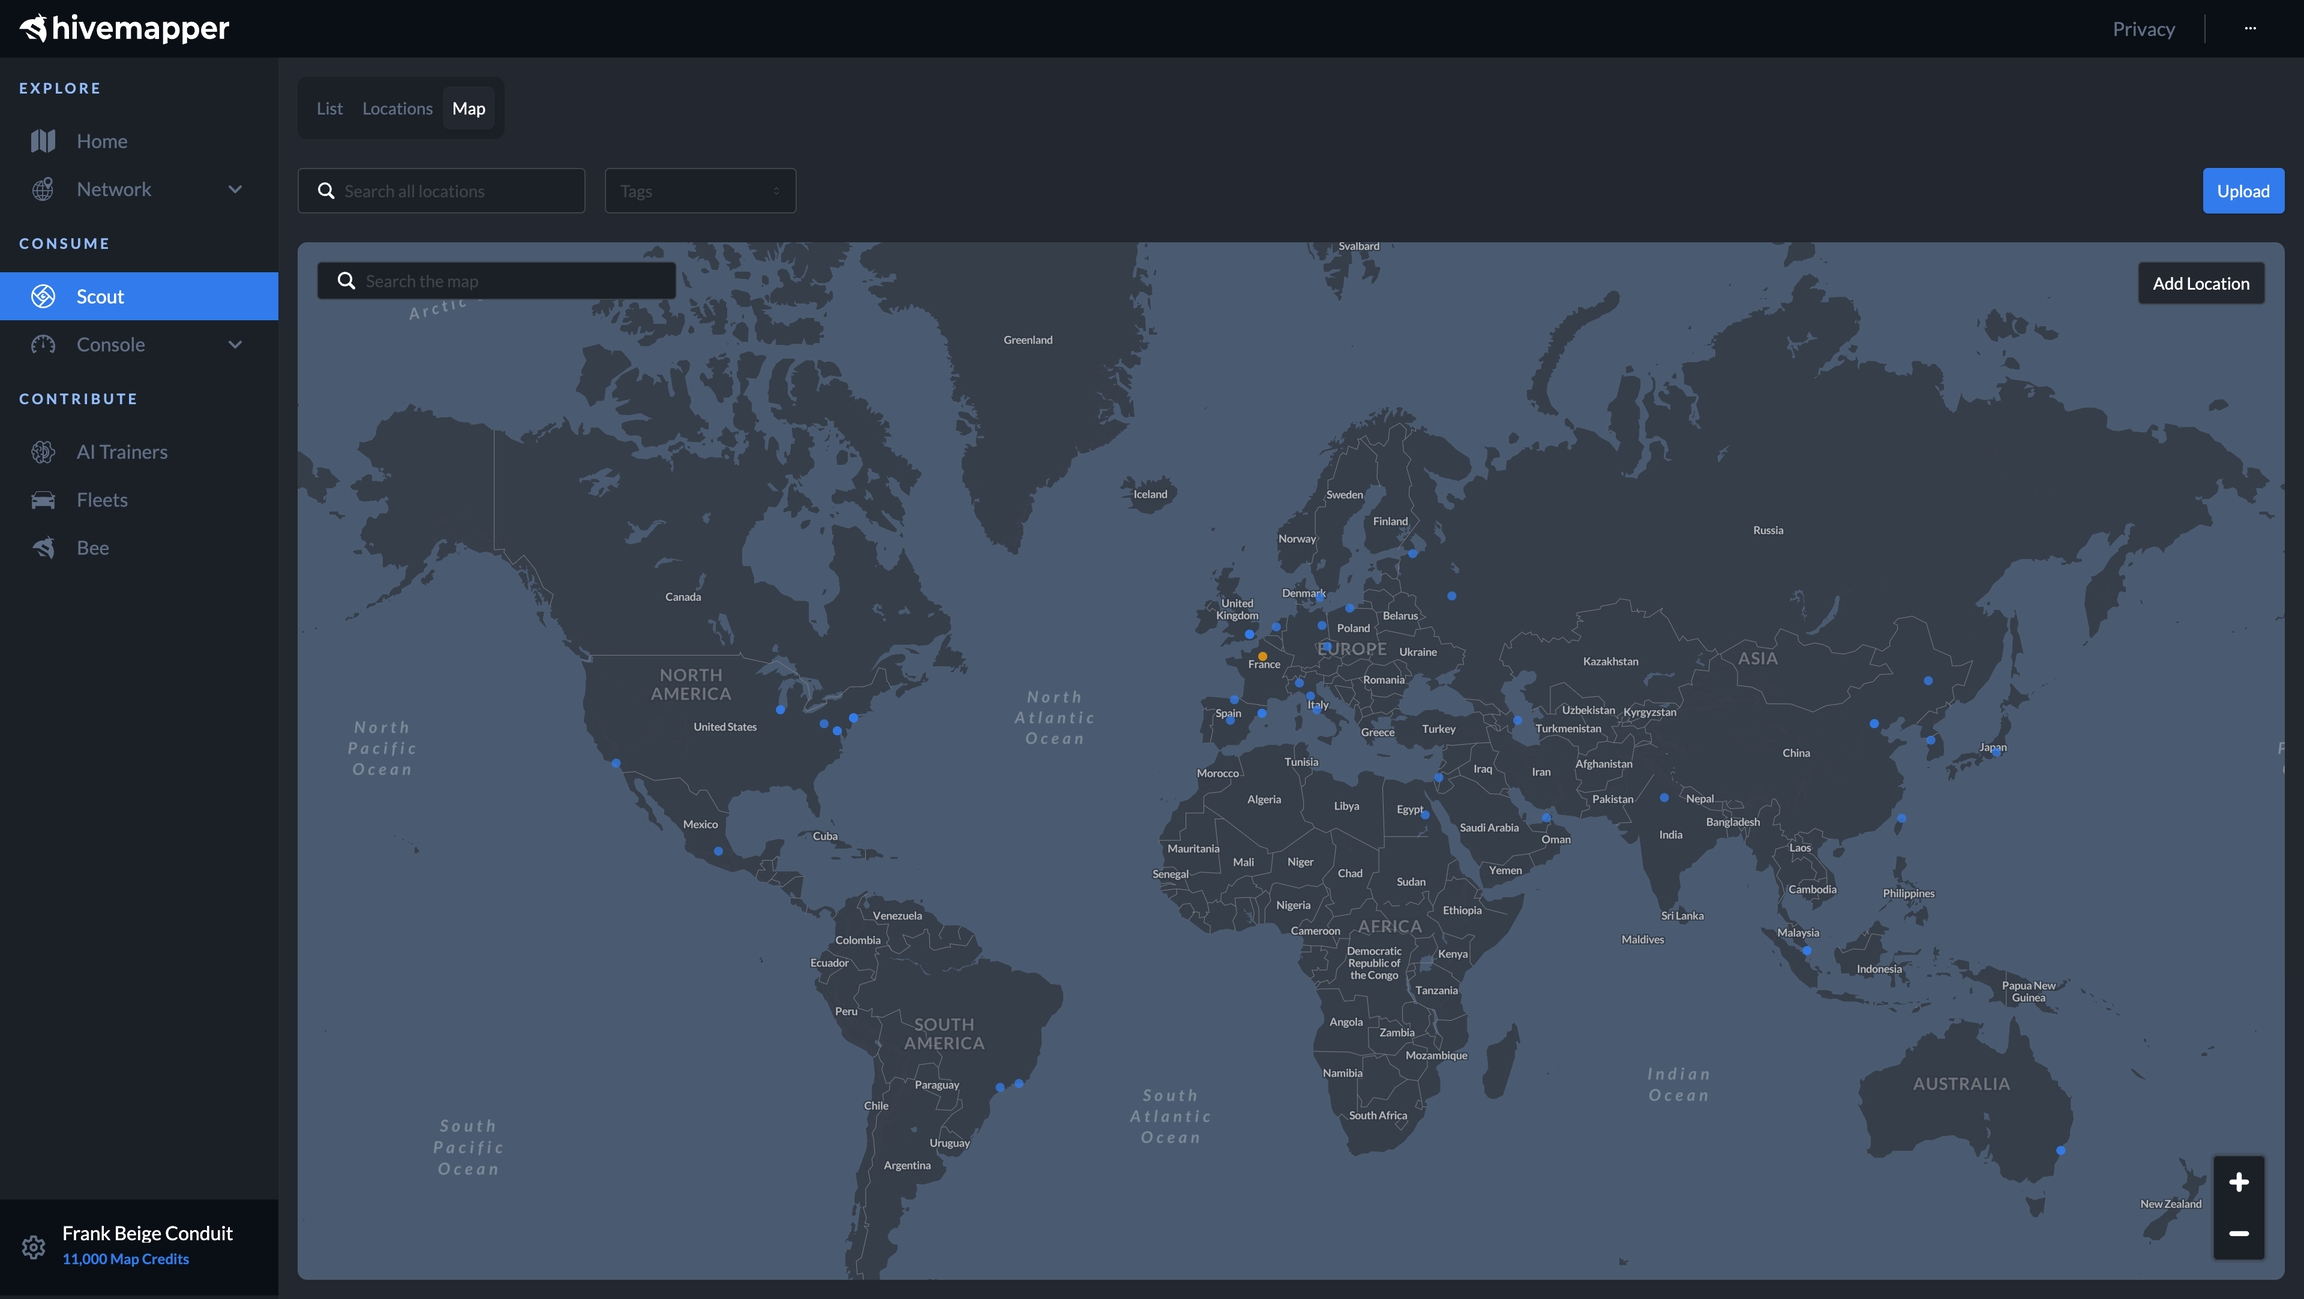
Map View
Displays all monitored locations on a map. Clicking a monitored location will expand the location details. Locations in yellow display locations with active Bursts.
Last updated